
H1 2025 S&P/TSX Indices: Performance and Fundamental Characteristics
The first half of 2025 has presented a turbulent global equity market, marked by unresolved tariff threats and persistent trade tensions. Despite this uncertainty, the Canadian equity market has shown relative resilience, outperforming the global market, including the U.S. This article explores the performance of various S&P/TSX indices relative to the benchmark S&P/TSX Composite Index* (the "parent indexˮ) and provides insights through a comparison of their trailing fundamental metrics.
Sector Indices
Recent market discussions have often centered on defensive sectors amidst surging economic and political uncertainties. However, a pair of S&P/TSX sector indices reveals a contradictory narrative. Notably, the S&P/TSX Consumer Discretionary Index has significantly outperformed the Consumer Staples Index, generally viewed as a traditionally defensive sector, as observed in Exhibit 1. A review of fundamental characteristics in Exhibit 1 shows the Consumer Discretionary Index demonstrated a better Return on Equity (ROE), a higher dividend yield, but a lower Price-to-Earnings (P/E) ratio. This intriguing divergence may signal that investors are anticipating stronger growth in the Consumer Discretionary sector, despite its perceived cyclicality, or that the Consumer Staples sectorʼs P/E is elevated due to factors beyond immediate growth.
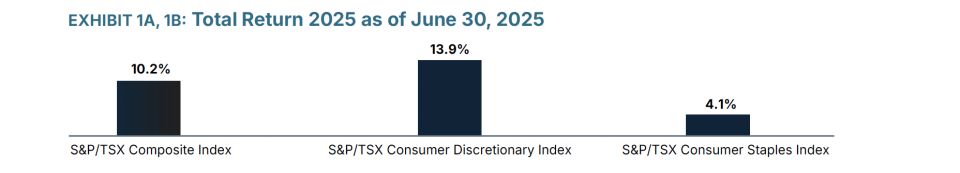
Source: Bloomberg Finance L.P.
Factor Indices
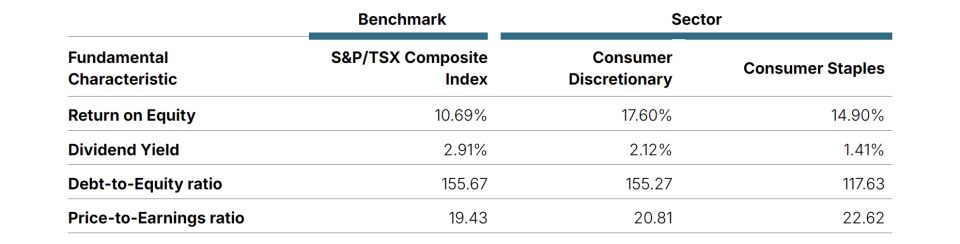
Certain factor indices have delivered notable year-to-date (YTD) performance results as observed in Exhibit 2. The S&P/TSX Composite Enhanced Value Index1, which focuses on constituents with high value scores (measured by book value-to-price, earnings-to-price, and sales-to-price ratios), has presented more attractive fundamental metrics relative to the parent index. It boasted a higher ROE, a higher dividend yield, and a lower Debt-to-Equity (D/E) ratio per Exhibit 2.
Conversely, the S&P/TSX Composite Low Volatility High Dividend Index2, comprising 50 least volatile, high-yielding stocks, slightly underperformed the parent index. While its high dividend yield is consistent with its methodology, it lagged in ROE and exhibited a lower P/E ratio alongside a higher D/E ratio. This suggests that the lower P/E may indicate lower growth expectations rather than undervalued stocks. Furthermore, the higher D/E ratio, coupled with a relatively lower ROE, may also not support a strong growth outlook for this index.
Source: Bloomberg Finance L.P.
1 2Source: S&P/TSX Index Factsheet
Thematic Indices
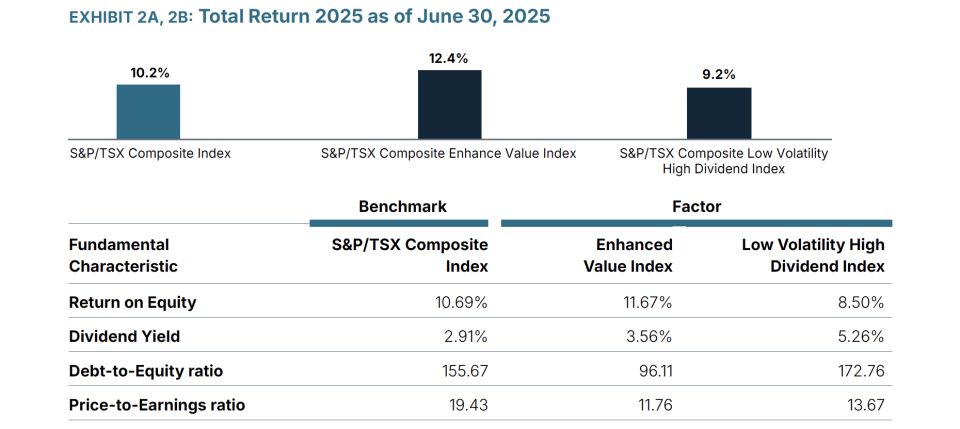
On the thematic front, two distinct S&P/TSX indices outperformed the parent index, with one showing notably strong performance relative to the parent index as observed in Exhibit 3. The S&P/TSX Composite ESG Index3, which integrates sustainability criteria and screens companies based on certain business activities, modestly outperformed the parent index. Based on trailing indicators, the ESG Index generally exhibited a similar level of metrics to the parent, with a notable difference being a higher ROE paired with a lower D/E ratio. Meanwhile, the S&P/TSX Global Gold Index, composed entirely of Materials sector companies with 66%4 exposure to Canadian issuers, delivered an almost 50% total return YTD. Despite a lower dividend yield, the Global Gold Index displayed a higher ROE and a significantly lower D/E ratio compared to both the parent and other mentioned indices. Its marginally higher P/E ratio than the parent index may support the case for bullish sentiment.
Source: Bloomberg Finance L.P.
3 4Source: S&P/TSX Index Factsheet as of June 30, 2025
Conclusion
Slicing the broad market index into various segments – be it sector, factor, or thematic – offers numerous insightful takeaways. Beyond analyzing mere performance, pairing these insights with fundamental metrics provide crucial clarity on the underlying reasons for an indexʼs relative outperformance or underperformance, enabling a more comprehensive understanding of market dynamics.
-
Copyright © 2025 TSX Inc. All rights reserved. Do not copy, distribute, sell or modify this document without TSX Inc.ʼs prior written consent. This information is provided for information purposes only. Neither TMX Group Limited nor any of its affiliated companies guarantees the completeness of the information contained in this publication, and we are not responsible for any errors or omissions in or your use of, or reliance on, the information. This publication is not intended to provide legal, accounting, tax, investment, financial or other advice and should not be relied upon for such advice. The information provided is not an invitation to purchase securities listed on Toronto Stock Exchange and/or TSX Venture Exchange. TMX Group and its affiliated companies do not endorse or recommend any securities referenced in this publication. TMX, the TMX design, TMX Datalinx, TMX Group, Toronto Stock Exchange, TSX, TSX Venture Exchange, and TSXV are the trademarks of TSX Inc. All other trademarks used are the property of their respective owners.
*The S&P/TSX Indices are products of S&P Dow Jones Indices LLC ("SPDJIˮ) and TSX Inc. ("TSXˮ). S&P® is a registered trademark of S&P Global, Inc. or its affiliates ("S&Pˮ); Dow Jones® is a registered trademark of Dow Jones Trademark Holdings LLC ("Dow Jonesˮ); and TSX® is a registered trademark of TSX. SPDJI, Dow Jones, S&P and TSX do not sponsor, endorse, sell or promote any products based on the Indices and none of such parties make any representation regarding the advisability of investing in such product(s) nor do they have any liability for any errors, omissions or interruptions of the Indices or any data related thereto.
The views and opinions expressed in this article are those of TSX Inc. and do not necessarily reflect the views and opinions of S&P, Dow Jones, or their affiliates.