
Malgré la hausse record des BPA ce trimestre, voit-on poindre des fragilités économiques?
- De plus en plus de sociétés revoient leurs estimations du bénéfice par action (BPA) à la hausse alors que le marché haussier perdure depuis près de trois ans.
- Les titres de consommation connaissent une reprise en dépit d'un éventail d'inquiétudes économiques.
- Nous passons les marchés au crible selon la zone géographique, la taille et le secteur pour évaluer la situation.
Le marché haussier perdure depuis bientôt trois ans. Les actions ont touché le fond en octobre 2022, à une époque où l'incertitude liée à l'inflation était élevée et où certaines grandes valeurs technologiques étaient en chute libre. Peu d'investisseurs se doutaient alors que l'intelligence artificielle (IA) était sur le point de surgir de nulle part et de générer des gains massifs pour des sociétés comme NVIDIA (NVDA), Meta Platforms (META), Broadcom (AVGO), Palantir (PLTR) et, plus récemment, Oracle (ORCL).
Une reprise qui s'étend, des résultats inégaux
Les actions mondiales ont repris du poil de la bête au quatrième trimestre de 2022 et sont restées généralement stables. Toutefois, la situation des bénéfices a été moins convaincante sur les marchés internationaux et au sein des sociétés américaines à petite et à moyenne capitalisation. Depuis le début de la décennie, Wall Street Horizon suit les tendances en matière de bénéfices à travers les différentes zones géographiques et tailles de capitalisation, et le troisième trimestre de 2025 est en voie de connaître la plus forte progression des BPA à ce jour.
Les bénéfices atteignent des niveaux records
Remarquez dans le graphique ci-dessous que le ratio entre les sociétés dont les bénéfices augmentent et celles dont les bénéfices diminuent est presque de deux pour un. L'écart de 29,2 points de pourcentage dépasse le record précédent de 28,6 points de pourcentage atteint au troisième trimestre de 2021, à l'époque où les sociétés comparaient leurs résultats trimestriels au niveau très faible de la mi-2020, au plus fort de la pandémie de COVID.
Ratio record des hausses et des baisses du BPA dans un marché haussier qui arrive à maturité*
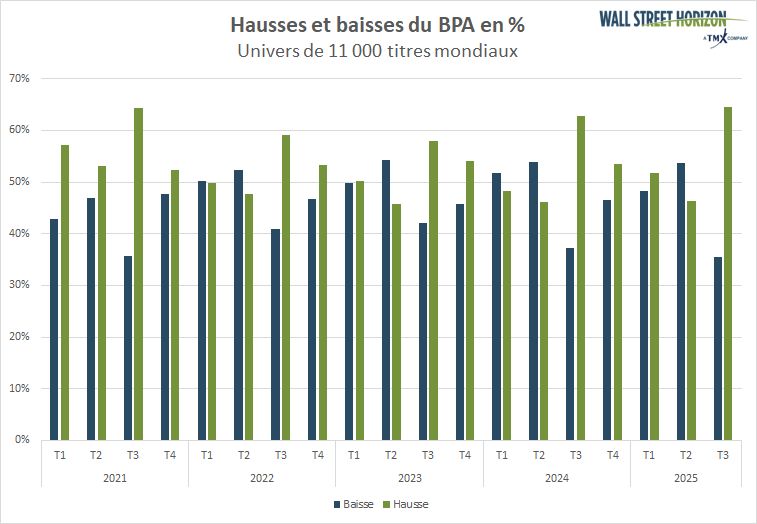
Source : Wall Street Horizon. *Ce graphique détaille les hausses et les baisses réelles du BPA d'un trimestre à l'autre.
Nous pouvons interpréter cette situation de deux manières.
C'est un signal haussier. Un plus grand nombre de sociétés génèrent des bénéfices (et des flux de trésorerie libres), ce qui contribue à soutenir la reprise mondiale. L'évolution des cours souligne cette logique, puisque l'indice MSCI Monde tous pays (ACWI) a enregistré une série de clôtures records ce mois-ci seulement.
C'est un signal baissier. Comme le dit le vieil adage : « Les marchés haussiers naissent dans le pessimisme, grandissent dans le scepticisme, mûrissent dans l'optimisme et meurent dans l'euphorie. » Le légendaire investisseur Sir John Templeton aurait pu s'inquiéter de notre graphique officieux de la semaine et craindre que nous ne soyons près du sommet des bénéfices et de l'enthousiasme débordant (bien que les indicateurs du sentiment des investisseurs soient encourageants).
Il est fort probable que nous nous situions quelque part entre les deux. FactSet souligne que le BPA de l'indice S&P 500 devrait augmenter de 10,7 % cette année et que la croissance devrait s'accélérer pour atteindre 13,7 % en 2026.[1] Bien entendu, les estimations de bénéfices sont généralement revues à la baisse à l'approche de l'année civile suivante. Néanmoins, les facteurs favorables fondamentaux semblent plus forts que la plupart des vents contraires à l'heure actuelle.
Un tableau macroéconomique imparfait
Des défis persistants, et d'autres nouveaux, se profilent à l'horizon. La fin de semaine dernière, Sherwin-Williams (SHW) a confirmé qu'elle suspendait sa cotisation équivalente au régime de retraite 401(k). Le cours de l'action de la société du secteur des matériaux, qui a des liens avec l'économie de consommation et est une composante de l'indice Dow Jones, a chuté lundi dernier.
Les bénéfices de la société de premier ordre de l'Ohio devraient être à peu près stables cette année, mais les estimations consensuelles prévoient une croissance annuelle faible à moyenne à deux chiffres en 2026 et en 2027. Les difficultés apparentes de SHW découlent de la faiblesse des ventes, des taux hypothécaires élevés et de l'augmentation des droits de douane.
SHW présente un tableau prudent, et sa situation met en évidence trois variables qui pourraient influencer les bénéfices américains au cours de l'année à venir.
- La loi « One Big, Beautiful Bill Act » (OBBBA) pourrait stimuler les investissements en capital et l'augmentation des dépenses de consommation en 2026.
- La reprise du cycle de réduction des taux de la Fed pourrait contribuer à faire baisser les taux hypothécaires (le taux fixe moyen sur 30 ans est aujourd'hui plus près de 6 % que de 7 %).
- En ce qui concerne les droits de douane, les nouveaux tarifs moyens en vigueur s'élèvent à près de 20 %, soit le taux le plus élevé depuis plus de 90 ans.
Éléments à surveiller avant la communication des résultats sur les BPA
À un mois du début de la période des résultats du troisième trimestre, les investisseurs doivent prêter attention au ton et aux perspectives qui seront présentés lors des congrès et des événements sectoriels . Il y a quelques semaines, nous avons détaillé les plus importants, et la volatilité a déjà fait surface dans certains secteurs. Les données intermédiaires relatives aux ventes, aux bénéfices, à la production et au volume peuvent également fournir des indices sur la situation macroéconomique. Enfin, d'autres éléments du « langage corporel » des sociétés, comme les tendances de rachat et les fractionnements d'actions, contribuent à former un portrait fondamental plus large.
Les perspectives des sociétés à petite et à moyenne capitalisation s'améliorent-elles?
En prenant du recul, il est encourageant de constater que les attentes en matière de croissance du BPA commencent à augmenter. Malgré un marché haussier de plusieurs années, les estimations de bénéfices pour l'espace des sociétés à petite et à moyenne capitalisation ont stagné depuis la fin du marché baissier il y a 35 mois. Les médias financiers s'empressent de souligner la vigueur récente des actions étrangères, mais des conditions commerciales plus favorables au niveau national pourraient jeter les bases d'une croissance plus large du BPA au cours des trimestres à venir.
Les secteurs premiers et derniers de classe pour la croissance des BPA
Au sein de l'indice S&P 500, les secteurs des technologies, des services publics, des matériaux, des produits industriels et des services financiers devraient tous afficher des hausses du BPA de près de 10 % au troisième trimestre, selon FactSet. Parmi les retardataires figurent les secteurs de l'énergie, de la consommation de base, de la consommation discrétionnaire, des soins de santé, de l'immobilier et des services de communication. Les sociétés du secteur de la consommation joueront peut-être le rôle le plus déterminant.
Les rapports sur les ventes au détail du Census Bureau des États-Unis n'indiquent pas de ralentissement prononcé des dépenses. Néanmoins, avec des baisses du BPA d'environ 3 % en glissement annuel prévues pour le trimestre en cours, les vents contraires susmentionnés se font sentir dans une part importante de l'économie.
En résumé
Les tendances mondiales de croissance du BPA des sociétés pourraient établir un nouveau record dans l'historique des données. En conjonction avec les nouveaux sommets atteints par les actions américaines et internationales, il semble que les facteurs fondamentaux jouent à plein régime. Nous avons relevé quelques signaux d'alerte possibles, tandis que les sociétés liées à la consommation restent parmi la minorité qui devrait afficher une croissance négative des bénéfices en glissement annuel. Les investisseurs doivent suivre les indicateurs économiques et les événements sectoriels au cours des semaines qui précèdent le début de la période de publication des résultats du troisième trimestre.
[1]Earnings Insight. John Butters, Factset, 12 septembre 2025. URL : https://advantage.factset.com/hubfs/Website/Resources%20Section/Research%20Desk/Earnings%20Insight/EarningsInsight_071825.pdf
© Wall Street Horizon, Inc., 2025. Tous droits réservés. Il est interdit de copier, de distribuer, de vendre ou de modifier le présent document sans obtenir le consentement écrit préalable de Wall Street Horizon. Ces renseignements sont fournis à titre d'information seulement. Ni Groupe TMX Limitée ni ses sociétés affiliées ne garantissent l'exhaustivité des renseignements qui figurent dans le présent document et ne sont responsables des erreurs ou des omissions que celui-ci pourrait comporter ni de l'utilisation qui pourrait en être faite. Le présent document ne vise pas à offrir des conseils en placement, en comptabilité ou en fiscalité ni des conseils juridiques, financiers ou autres, et l'on ne doit pas s'en remettre à celui-ci pour de tels conseils. L'information présentée ne vise pas à encourager l'achat de titres, qu'ils soient inscrits ou non à la Bourse de Toronto ou à la Bourse de croissance TSX. Le Groupe TMX et ses sociétés affiliées ne cautionnent ni ne recommandent les titres mentionnés dans le présent document. Cette publication ne constitue pas une offre de vente ou la sollicitation d'une offre d'achat, et il ne peut y avoir de vente de titres dans un État ou un territoire où une telle offre, sollicitation ou vente serait illégale avant l'inscription ou l'admission des titres en vertu des lois sur les valeurs mobilières d'un tel État ou d'un tel territoire. TMX, le logo de TMX, Groupe TMX, Bourse de Toronto, TSX et Bourse de croissance TSX sont des marques de commerce de TSX Inc. et elles sont utilisées sous licence. Wall Street Horizon est une marque de commerce de Wall Street Horizon, Inc. Toutes les autres marques de commerce mentionnées dans le présent document appartiennent à leurs propriétaires respectifs.