
Unlocking Hidden Value and Insights with S&P/TSX Index Rebalancing Data and TMX Datalinx Short Interest Service
The quarterly rebalancing of major Canadian benchmarks like the S&P/TSX 60 Index* is more than an administrative exercise. It represents the formal market acknowledgement of a company's trajectory. These shifts trigger predictable passive inflows or outflows, creating immediate and often, exploitable price effects.
While most investors focus on the "passive tailwind" of inclusion, savvy market participants look deeper. By pairing S&P/TSX Index Proforma Data with proprietary sentiment from the TMX Datalinx Short Interest Services1, investors can distinguish between technical price action and genuine institutional conviction.
1. The Confirmation Signal (Index Inclusion + Low Short Interest)
An addition to an index is inherently positive. It creates mandatory demand from index-tracking funds. While a slight rise in short interest is common (due to market makers hedging ETF creations), the magnitude of that rise is the real signal.
Actionable Insight: If a new constituent maintains low or declining short interest despite the inclusion, it confirms a "consensus buy." The lack of bearish conviction suggests the fundamental story is robust enough to withstand the "sell the news" impulse.
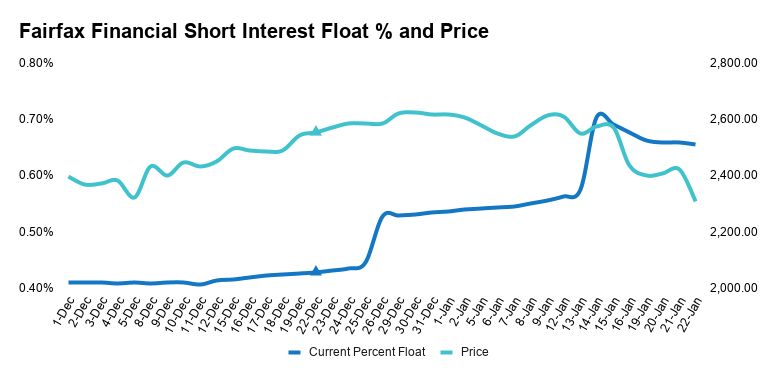
- Case Study: Fairfax Financial Holdings (Ticker: FFH)
- Event: Announced for inclusion in the S&P/TSX 60 Index Dec 5, 2025; Effective Dec 22, 2025
- Data: Post-inclusion, short float edged from 0.4% to 0.56% (30-day average post inclusion)
- Outcome: While the price appreciated initially, a subsequent cautious outlook from a sell-side firm saw the price retreat. Crucially, this price drop was validated by a simultaneous rise in short float, signaling that the "bullish consensus" had fractured.
Source: S&P/TSX Proforma File, TMX Datalinx Short Interest Service
2. The Reversal Signal (Index Deletion + Decreasing Short Interest)
Index deletion usually causes forced selling from passive funds, driving the price down. This technical selling pressure can drive a stock's price below its intrinsic value.
Actionable Insight: When a stock is removed from the index, and the short interest drops rapidly or is already near its lows, it suggests that the bearish conviction has been largely exhausted or covered. This combination can highlight a potential oversold value play that professional investors are no longer actively betting against.
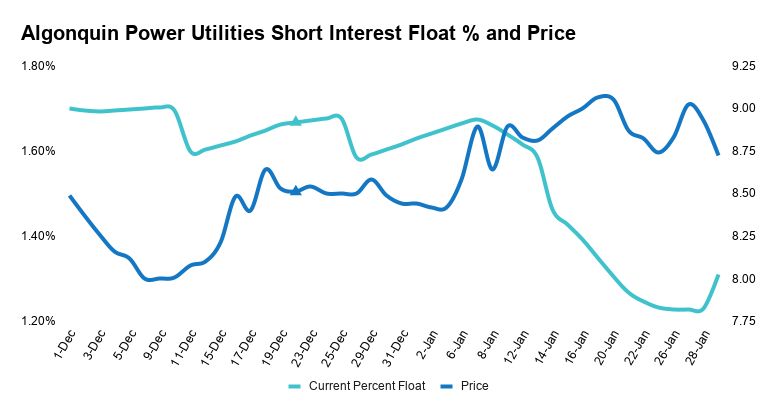
- Case Study: Algonquin Power & Utilities Corp. (Ticker: AQN)
- Event: Announced for deletion from the S&P/TSX 60 Index Dec 5, 2025; Effective Dec 22, 2025
- Data: Short float peaked near 1.7% on the announcement and plummeted to 1.5% (30-day average post deletion)
- Outcome: AQN hit a price floor following the announcement. As shorts covered, the price continued its upward trajectory past the effective date.
Source: S&P/TSX Proforma File, TMX Datalinx Short Interest Service
Combining these two powerful market datasets can sharpen investment decision-making and help identify mispriced opportunities around index rebalancing events. It allows investors to see rebalancing as a "mechanical" event into a "strategic" one.
1S3 Partners, a leading provider of Short Interest data
-
Copyright © 2026 TSX Inc. All rights reserved. Do not copy, distribute, sell or modify this document without TSX Inc.'s prior written consent. This information is provided for information purposes only. Neither TMX Group Limited nor any of its affiliated companies guarantees the completeness of the information contained in this publication, and we are not responsible for any errors or omissions in or your use of, or reliance on, the information. This publication is not intended to provide legal, accounting, tax, investment, financial or other advice and should not be relied upon for such advice. The information provided is not an invitation to purchase securities listed on Toronto Stock Exchange and/or TSX Venture Exchange. TMX Group and its affiliated companies do not endorse or recommend any securities referenced in this publication. TMX, the TMX design, TMX Group, TMX Money, TMX Datalinx, Toronto Stock Exchange, TSX Venture Exchange, and TSX are the trademarks of TSX Inc.
*The S&P/TSX 60 Index (the "Index") referenced in this article is the product of S&P Dow Jones Indices LLC ("SPDJI") and TSX Inc. ("TSX"). S&P® is a registered trademark of S&P Global, Inc. or its affiliates ("S&P"); Dow Jones® is a registered trademark of Dow Jones Trademark Holdings LLC ("Dow Jones"); and TSX® is a registered trademark of TSX. These trademarks have been sublicensed for certain purposes by SPDJI and TSX. SPDJI, Dow Jones, S&P and TSX do not sponsor, endorse, sell or promote any products based on the Index and none of such parties make any representation regarding the advisability of investing in such product(s) nor do they have any liability for any errors, omissions or interruptions of the Indices or any data related thereto.
The views and opinions expressed in this article are those of TSX Inc. and do not necessarily reflect the views and opinions of S&P, Dow Jones, or their affiliates.